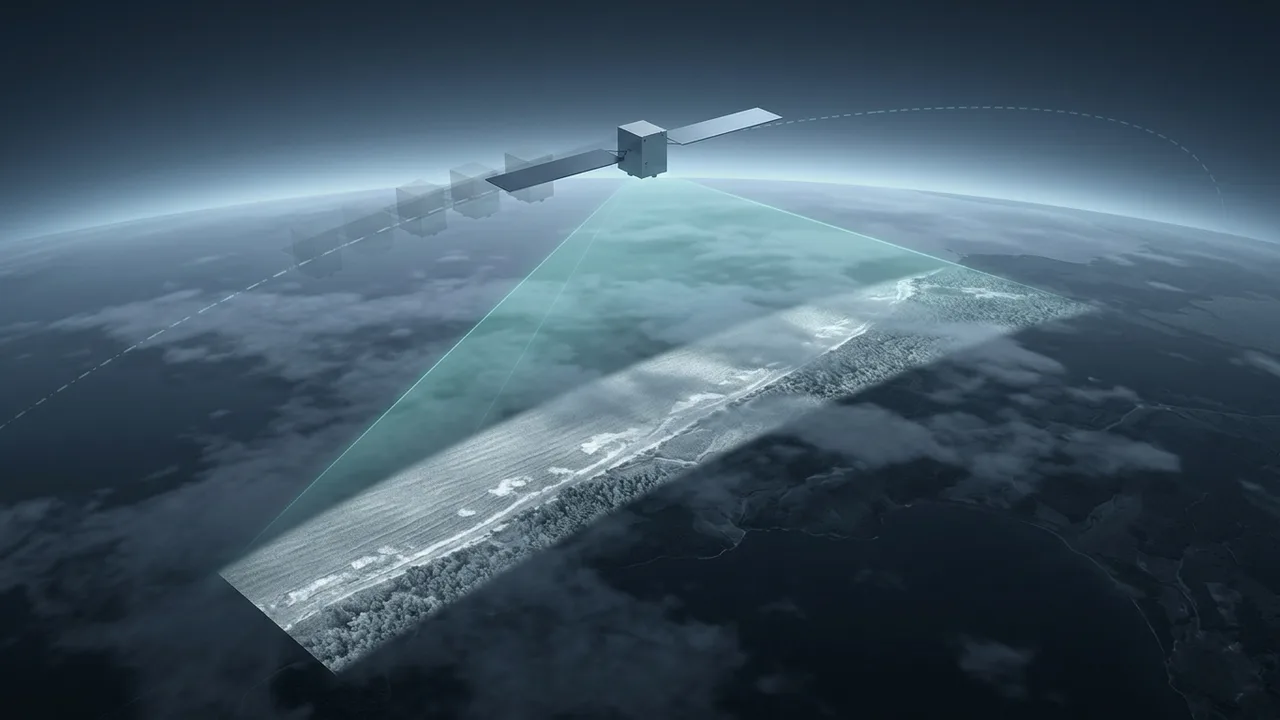
On a night with thick cloud, a satellite camera cannot see the ground. Yet some instruments can record the waves on the sea, icebergs and forests under that same cloud, on that same night, as black-and-white images. One of them is synthetic aperture radar (SAR).
It is an active instrument. It sends out pulses of energy and records the energy that bounces back from the ground. Microwaves pass through clouds, so it can see the surface at night and in cloudy weather.
The hard part is sharpness. A radio picture as fine as a photo would need a huge antenna, and SAR avoids that problem by moving a small one.
A bigger antenna gives a sharper picture
Any wave that passes through an opening spreads out because of diffraction. That opening is called the aperture, the same word that appears in "synthetic aperture radar." The angle of that spread, and the spatial resolution that follows from it, grows with wavelength and shrinks as the aperture gets bigger.
By this rule, a longer wavelength needs a proportionally larger antenna to keep the same resolution. From orbit, a camera with an aperture of a few tens of centimeters can reach a few tens of meters of resolution in visible or infrared light. Microwaves change the picture, because their wavelengths are centimeters instead of micrometers.
NASA Earthdata gives a concrete example. Suppose a satellite uses C-band radar, whose waves are about 5 cm long, and wants 10 m resolution. It would need an antenna of about 4,250 m in length. Carrying an antenna like that on a satellite is not practical.
Along the range: round-trip time and pulses
A radar image has two directions. The direction the aircraft or satellite travels is along-track, also called azimuth. The direction at right angles to the flight path is range. A SAR in space usually points its beam sideways, at right angles to its travel, and sweeps a strip of ground beside its path as it moves.
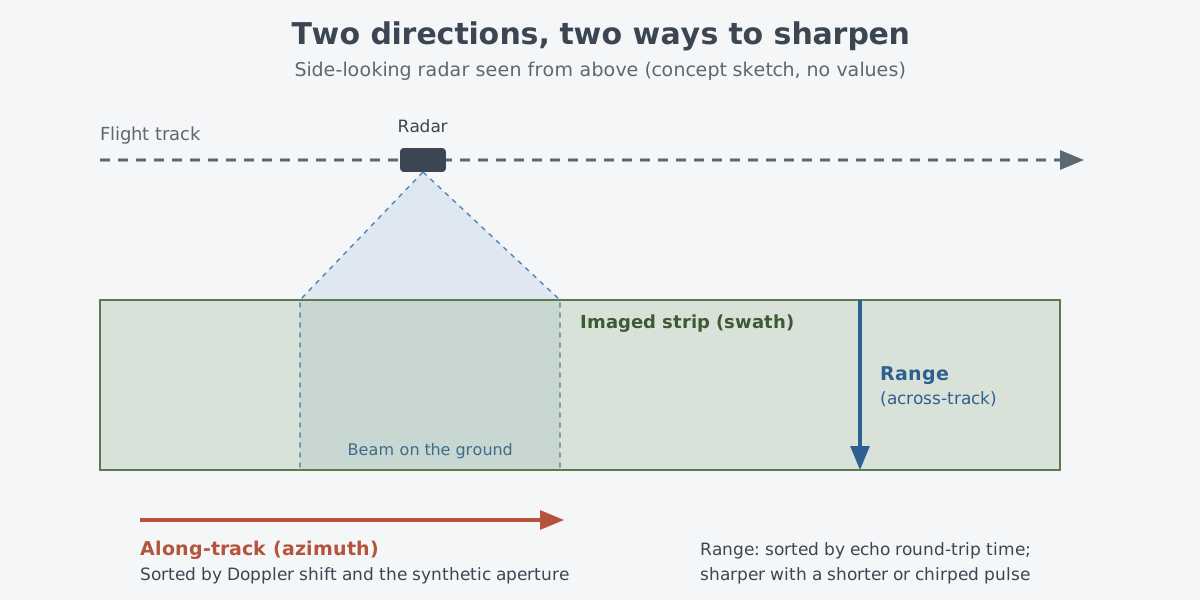
Range follows from the basic radar principle. By timing exactly how long a pulse takes to go out and come back, the radar finds the distance to the reflecting object along its line of sight. This is called the slant range.
Range resolution does not depend directly on distance or wavelength. It is set by the effective, processed pulse width, and finer range resolution calls for a wider pulse bandwidth and a higher data rate. Most modern radars, SAR included, send a pulse called a chirp. Within a single chirp, the frequency changes linearly across a set range, and that change sets the radar's bandwidth.
Building a big antenna by moving
That leaves the along-track direction. The solution was to move the antenna instead of making it bigger. A string of measurements from a short antenna is combined so that it acts like a much longer one. This is the synthetic aperture.
A radar that looks at right angles to its path has a wide beam. So a point on the ground stays inside the beam for quite a while as the beam passes over it. At satellite speeds, that lasts from a fraction of a second up to a few seconds.
During that time the radar records phase and Doppler information. Signal processing then builds an aperture as long as the distance the antenna traveled while the point was in the beam.
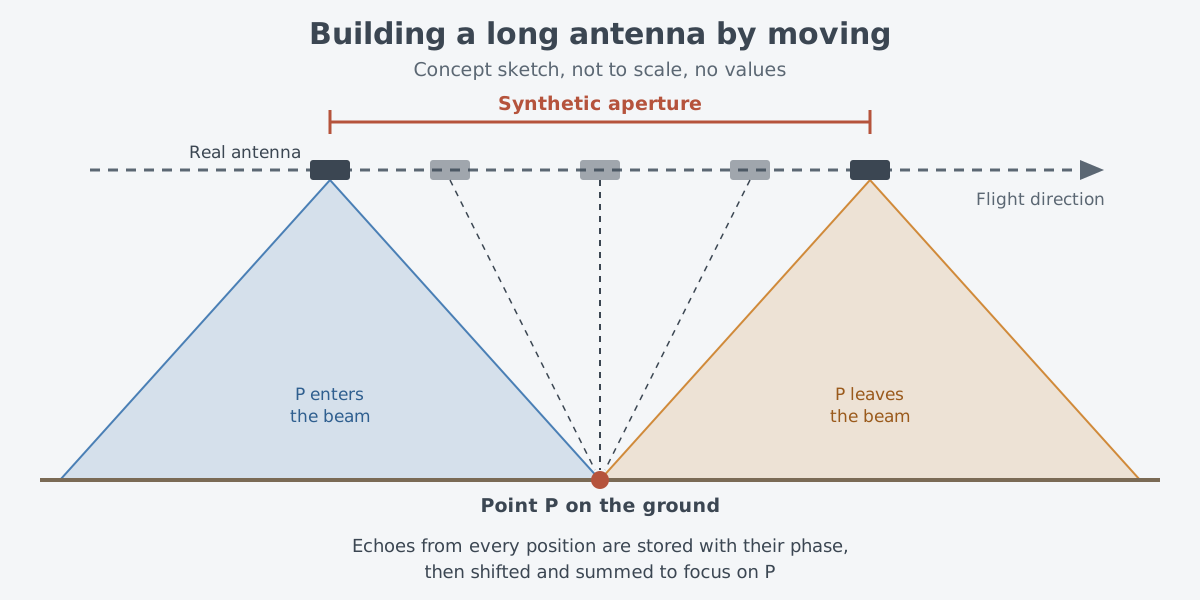
The processing works like this. The radar stores the phase history of the echo at each position as the beam passes. It then weights the echoes, shifts their phase and adds them up. This focuses on one point at a time and suppresses all the others.
Often thousands of pulses are added for each resolution cell. The method works because the pulses travel at the speed of light, far faster than the satellite moves.
Picture walking down a long hallway while recording the echo from one spot, then lining up the recordings in time and stacking them. The real process is different. SAR lines up the phase of radio waves, not the rhythm of sound, and a signal processor does it by calculation.
The synthesized aperture can be longer than the real antenna by several powers of ten, and it can produce radar images with a resolution of a few meters.
According to the NOAA SAR manual, along-track resolution approaches half the antenna's physical length and, to a first approximation, does not depend on wavelength or distance. It looks like a contradiction of diffraction, but a smaller antenna gives better resolution. A small antenna has a wide beam, so it lights each point for longer, and the synthetic aperture grows longer to match.
Sorting by Doppler
The key to sorting positions along the track is the Doppler shift. An ambulance siren sounds different coming toward you and going away. In the same way, when the radar and an object move toward or away from each other, the returning radio waves change frequency.
In 1951, Carl Wiley, who worked at Goodyear Aircraft, focused on this. Each object in the beam moves relative to the antenna at a slightly different speed, so each one gets its own Doppler shift. As the radar passes, an object's along-track position and its Doppler shift at that moment pair up one to one.
Wiley concluded that a careful frequency analysis of the echoes could separate along-track positions more finely than the physical beam width allowed. After this discovery, along-track resolution was set by the spread of Doppler frequencies in the returning signal, not by the width of the antenna beam.
How a SAR image differs from a photo
The first time you look at a SAR image, it seems quite different from a photo. The positions and proportions of objects can look distorted, and the whole image looks grainy. Depending on the shape of the ground, areas of layover and shadow can also appear.
The grainy "salt and pepper" pattern is called speckle. When a single resolution cell holds many scatterers, the coherent pulse comes back from all of them, and the returns add up or cancel out through interference. Unlike random noise, speckle appears again if the image is taken under identical conditions. It is reduced by multi-looking, which averages several separate looks.
Wavelength changes the image too. SAR wavelengths are grouped into bands with letter names such as X, C, L and P. X-band, at about 3 cm, barely enters broadleaf woodland; it mostly bounces off the leaves in the treetops. L-band, at about 23 cm, reaches deeper into the canopy.
Because SAR records phase, it can do one more thing. Interferometric SAR (InSAR) uses the recorded phase to work out how far the ground is from the instrument. Comparing two or more passes over the same place at different times then reveals changes in the land surface. NASA Earthdata explains that these measurements are accurate to the centimeter level and are used to find ground deformation after volcanic eruptions and earthquakes.
SAR has also been used to study Antarctic icebergs, track oil spills into marshes and map the wetlands of Alaska.
A short history: from 1951 to Seasat
SAR began in the 1950s as a tool for military reconnaissance. Since the 1940s there had been a need to watch the ground from the air around the clock, in any weather. Radar passes through cloud and fog, so it seemed the obvious choice.
The catch was that a useful resolution called for an antenna roughly as large as a football field. That was far too big for a reconnaissance aircraft.
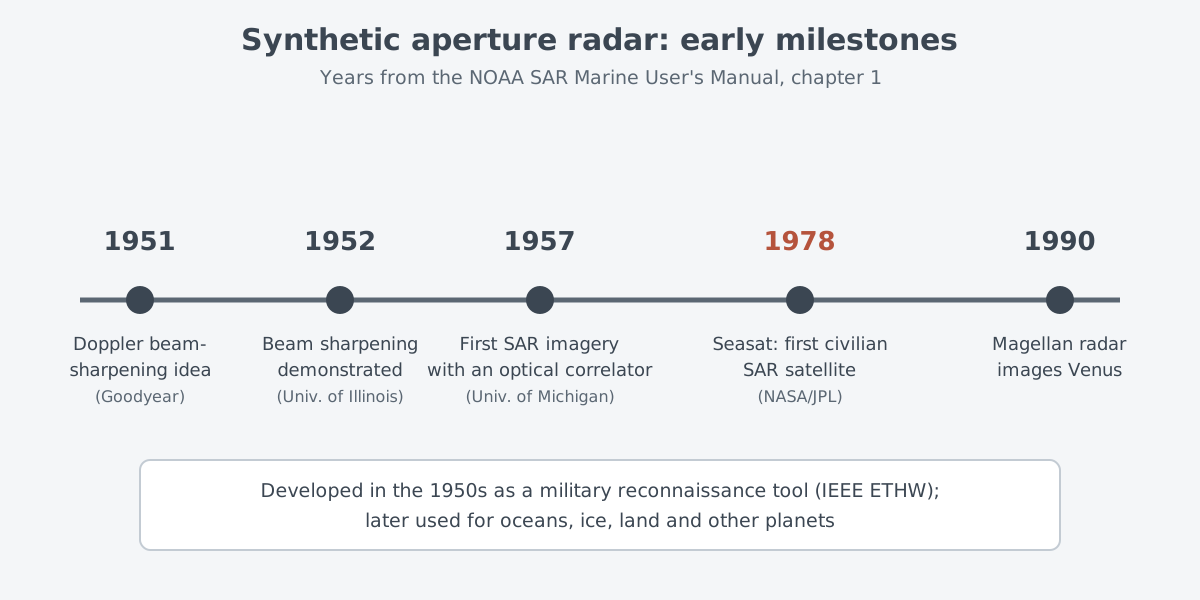
A SAR manual published by the National Oceanic and Atmospheric Administration (NOAA) lists the early milestones. In 1951 Wiley put forward the Doppler beam-sharpening concept, and in 1952 the University of Illinois demonstrated a beam-sharpening concept. The Illinois researchers had reached the idea independently. In 1957 the University of Michigan made the first SAR images with an optical correlator.
Lockheed Martin, which counts Goodyear Aircraft among its legacy companies, says in its own history article that Wiley's 1954 patent application is widely considered the first SAR patent. It also names a system called Douser, carried on a C-47 transport, as the first to make an image with SAR. Which one counts as the first SAR image depends on the source.
SAR reached space in 1978. Seasat, launched in June that year, became the first SAR satellite for civilian use. It worked until early October, when a massive short circuit hit its power system.
After that, Canada, Europe, Japan and Russia (formerly the Soviet Union) put SAR satellites into orbit to watch the sea and land. In 1990 the SAR on the Magellan spacecraft imaged the surface of Venus.
What makes it hard
The first difficulty is computing. The first digital processors for Seasat took 20 hours to turn 18 seconds of collected data into one image covering 100 km × 100 km. That delay disappeared as digital technology improved, but when the manual was written, collecting and processing SAR data was still a major challenge for satellite and mission designers. Spaceborne SAR also has a built-in limit on how much data it can collect.
The second is a trade-off. The NOAA manual notes that the wish for wider coverage eventually collides with the wish for finer along-track resolution.
A similar trade-off shows up in imaging modes. Sandia National Laboratories describes a Spotlight mode, which dwells on one place for maximum detail, and a Stripmap mode, which records a continuous, even strip. In Spotlight mode, finer resolution means less ground covered in each image.
The third is correction. Raw SAR data is not yet an image. It contains distortions such as range curvature, the Earth's rotation during the observation, the eccentricity of the orbit and small wobbles in the satellite's attitude. These have to be corrected before an image can be formed.
Where this meets lasers: diffraction and aperture
The barrier SAR had to get around is familiar from lasers. The rule that resolution grows with wavelength and shrinks with aperture comes from diffraction, and the same diffraction sets how much a laser beam spreads. Visible light has a short wavelength, so a small aperture gives a sharp result. Microwaves have long wavelengths, so the same sharpness needed an enormous aperture.
Phase is the other link. SAR only forms an image when it adds echoes with their phases lined up, and speckle comes from interference between coherent waves. Laser light is explained by the same physics of coherence and interference. How diffraction spreads a beam continues in Why a beam spreads: divergence, focus and aperture, and measuring distance with light continues in Measuring with lasers: range finding and lidar basics.
What to read next
- Radar: measuring distance and motion with radio waves: round-trip timing and the Doppler effect from the start.
- Phased arrays and AESA radar: steering without moving: another way of working with phase, this time to steer a beam.
- Interference and diffraction: how light adds up and spreads: the two effects behind SAR resolution and speckle, shown with light.