Read about radar for a while and you keep running into phrases like "S-band weather radar" or "X-band radar." What does a single letter tell you? It is a label for a slice of the radio spectrum: the band of frequency that the radar uses.
Change the band and the same size of antenna sends out a beam of a different width, and rain weakens the signal by a different amount. This article starts with where the letters came from. It then looks at what really separates bands such as L, S, C and X, and why each band tends to end up with different jobs.
The basics of how radar measures distance with radio waves are in "Radar: measuring distance and motion with radio waves."
Where the letters came from
Letters like L, S and X were never meant to carry a meaning. The American Meteorological Society (AMS) Glossary of Meteorology explains that radar frequency bands were first given code letters for secrecy during World War II. Those letters are still in common use. The exact frequency range behind each letter, though, has been redefined to some degree since then.
Engineers kept the letters after the war. They used them as a short way to name the band a radar works in, and the habit became accepted practice among radar engineers.
One problem was that other fields used similar letter names. Letter band names from other microwave users were being misapplied to radar, which caused confusion.
To clear it up, the Institute of Electrical and Electronics Engineers (IEEE) first issued the standard IEEE Std 521 in 1976. The 1984 revision kept the existing letters and assigned V and W to part of the millimeter-wave region. The 2002 revision brought its definition of millimeter waves in line with the International Telecommunication Union (ITU).
The standard is built to fit with the ITU naming system. HF and VHF mean the same thing in both. The radar names take the existing ITU bands and split them more finely, the way radar practice needs.
Higher frequency, shorter wave
To make sense of bands, start with how frequency and wavelength fit together. Radio waves travel at the speed of light, 300 million meters per second. The more times a wave swings each second, the shorter each swing becomes.
wavelength = speed of light ÷ frequency
Examples from an MIT Lincoln Laboratory radar lecture make it concrete. At 1 GHz the wavelength is 30 cm, at 3 GHz it is 10 cm, and at 10 GHz it is 3 cm. Multiply the frequency by ten and the wavelength drops to a tenth.
Most radar waves sit in the microwave region. NASA Earth Observatory puts that region at wavelengths from 1 mm to 1 m and counts every range that human-built radars use as part of it. Most waves in this region pass through the atmosphere unimpeded and reach the ground.
The bands at a glance
Line up the IEEE radar bands by frequency and you get L at 1–2 GHz, S at 2–4 GHz, C at 4–8 GHz and X at 8–12 GHz. Above those come Ku at 12–18 GHz, K at 18–27 GHz and Ka at 27–40 GHz. Below L, the ITU names take over: HF (3–30 MHz), VHF (30–300 MHz) and UHF (300 MHz–1 GHz).
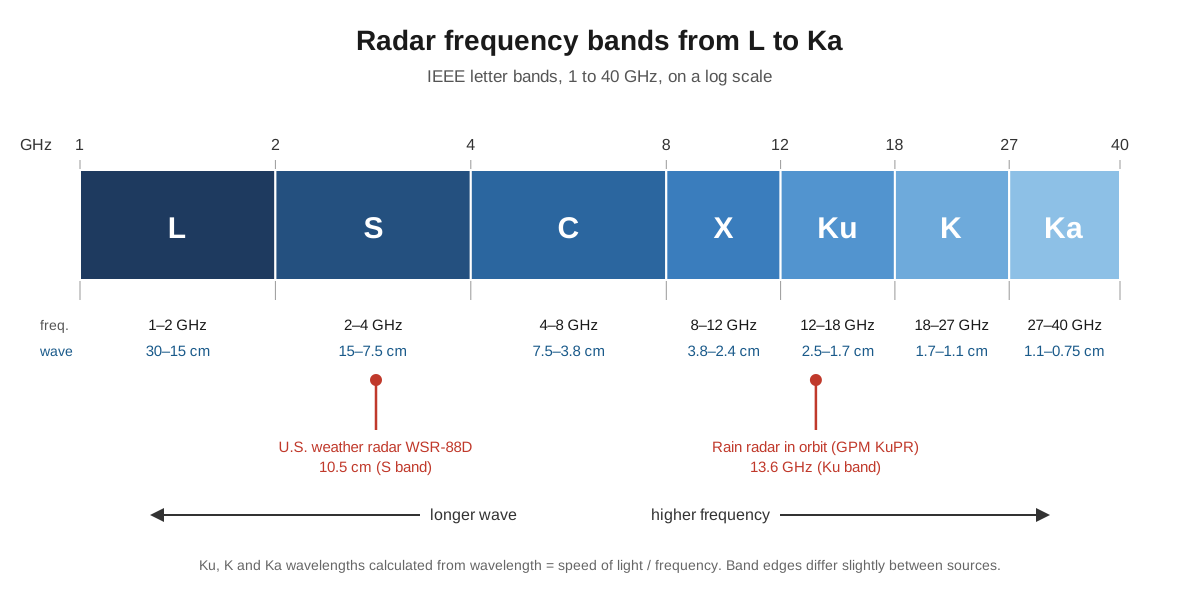
In wavelength, L band runs from 30 to 15 cm and S band from 15 to 7.5 cm. C band covers 7.5 to 3.8 cm, and X band 3.8 to 2.4 cm. These values come from a table on NASA Earthdata. Working out Ku, K and Ka the same way puts them between 2.5 cm and 0.75 cm.
The edges are not always written the same way. The lecture's table lumps everything above 40 GHz into W, while the IEEE standard has assigned V and W separately to part of that region since 1984. This is the same redefinition of letter ranges over time, showing up again.
Short waves: narrow beams and fine detail
During World War II, radar moved to higher frequencies, which means shorter waves. The IEEE History Center's Engineering and Technology History Wiki (ETHW) counts this shift among the most important steps forward for radar during the war. A shorter wave was easier to squeeze into a tight beam, so a distant object sent more energy back. Even more important, higher frequencies gave greater resolution.
The starting point was waves measured in meters. Around 1940, the Chain Home radar that gave early warning during the Battle of Britain worked at 20–30 MHz, with wavelengths of 10–15 m. The key breakthrough for the move to microwaves was the cavity magnetron, invented in 1940 at the University of Birmingham in Britain.
Why do short waves help? Measuring an antenna in wavelengths gives a clue. The MIT Lincoln Laboratory antenna lecture explains that gain rises as an antenna becomes electrically larger, meaning its diameter spans more wavelengths. A dish 1 m across holds about thirty X-band waves of 3 cm, but only about three waves of 30 cm.
Resolution follows the same ratio. How sharp a radar image can be depends directly on the ratio of wavelength to antenna length, and for a given wavelength a longer antenna gives higher resolution. In a NASA example, a satellite using C band at about 5 cm would need an antenna about 4,250 m long to reach 10 m resolution. That is far too big to fly.
Instead, synthetic aperture radar (SAR) combines a series of measurements from a shorter antenna to imitate a much larger one.
Wavelength is a bit like the width of a paintbrush. A finer brush can paint smaller details, and a textbook rule says the same holds for any probe: a shorter wave can pick out finer detail. In practice the brush is not the whole story. Radar resolution depends on the ratio of wavelength to antenna size, not on wavelength alone.
The price of short waves: rain
Short waves are not always better. The weakening of a radio wave as it travels through the air is called attenuation. According to the AMS glossary, attenuation from atmospheric gases, rain and cloud particles is severe in every band above X band. Even X band can suffer severe attenuation in heavy rain.
The bands mainly used to measure precipitation are S, C and X. The WSR-88D is the backbone of the U.S. weather radar network. In the early and middle 1990s it became the operational network radar for the National Weather Service (NWS), the U.S. Air Force and the Federal Aviation Administration (FAA). Its nominal transmitted wavelength is 10.5 cm, which puts it in S band.
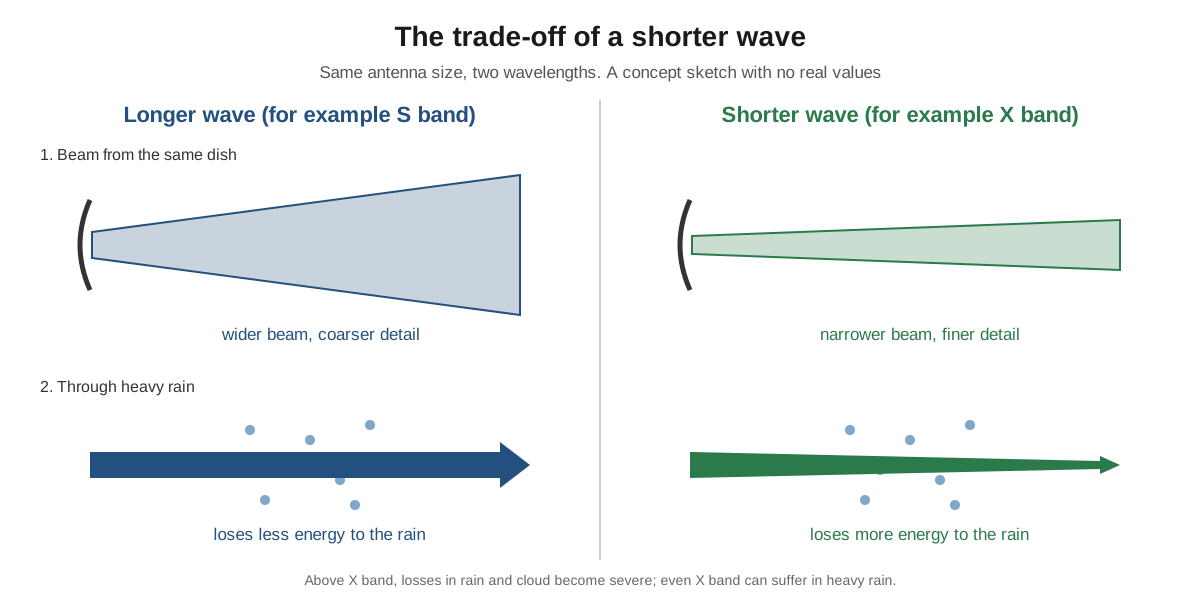
That does not make the higher bands useless for weather. K, Ka and W band radars cannot see far through rain, but they can detect clouds, so they are used for cloud observations. The difference in attenuation can even become a source of information.
The Dual-frequency Precipitation Radar (DPR) on NASA's Global Precipitation Measurement (GPM) Core Observatory is one example. It carries a Ku-band radar at 13.6 GHz alongside a Ka-band radar and tells rain from snow by the difference in attenuation between the two bands.
Into forests and soil: what long waves are good for
Long waves have another strength. Wavelength sets how a radar signal interacts with a surface and how far it gets into a material. NASA Earthdata describes X band, at about 3 cm, as barely getting into a broadleaf forest and mostly bouncing off the leaves in the upper canopy. L band, at about 23 cm, gets deeper through the canopy and reaches large branches and trunks.
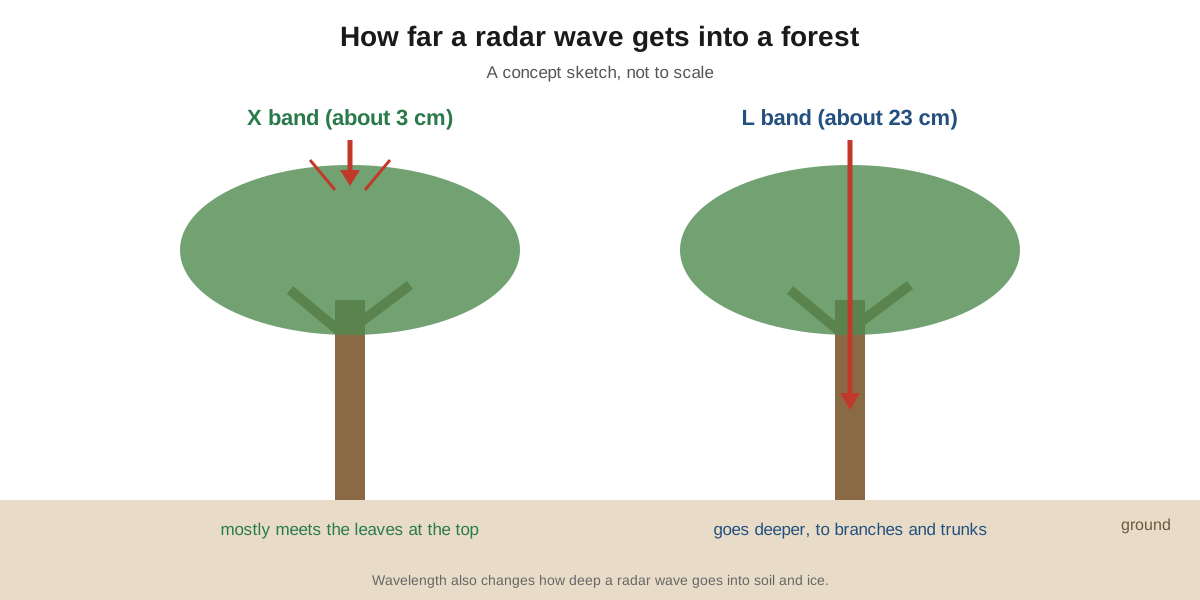
Forests are not the only case. In soil and ice as well, the depth a wave reaches changes with wavelength.
The jobs of satellite SAR bands reflect this. X band serves high-resolution work such as urban monitoring. C band is the SAR "workhorse" for global mapping and change detection. L band serves work that needs deeper reach, such as biomass and vegetation mapping.
NISAR, a mission of NASA and the Indian Space Research Organisation (ISRO), collects SAR data in both L band and S band.
Which band does which job
In the MIT lecture, the IEEE band table carries a column of typical uses. From the lower bands upward come search radars, search and track radars, and fire control and imaging radars, with missile seekers at the top. Imaging radars, which need fine detail, sit toward the short-wave end, which fits the trade-off described above.
These are only common patterns. Precipitation measurement uses S, C and X bands side by side, and cloud observation uses K, Ka and W. Some weather radars, such as wind profilers, work much lower, in the UHF and VHF bands.
No single band is right for every job. Choosing one means balancing beam width, how well the signal holds up in rain, how deep it reaches and how large the antenna can be.
Same rule, far shorter waves: light
The rule that wavelength shapes behavior holds for light too. Visible light spans 0.4–0.7 µm. Next to a 10.5 cm weather radar, a visible wave is about 1/200,000 as long.
The textbook rule that shorter waves reveal smaller details carries straight over to lasers. What a laser's wavelength changes is covered in "Why wavelength matters: visible and invisible light." What happens to that light on its way through the air is in "Light through air: absorption, scattering, turbulence, thermal blooming."
What to read next
- Radar: measuring distance and motion with radio waves: how round-trip time gives distance, and how microwave radar began.
- Synthetic aperture radar: images from radio waves: how to get high resolution without a 4,250 m antenna.
- Phased arrays and AESA radar: steering without moving: antennas that change beam direction electronically.
- Doppler radar: picking out things that move: how the same kind of S-band weather radar reads the motion of rain.