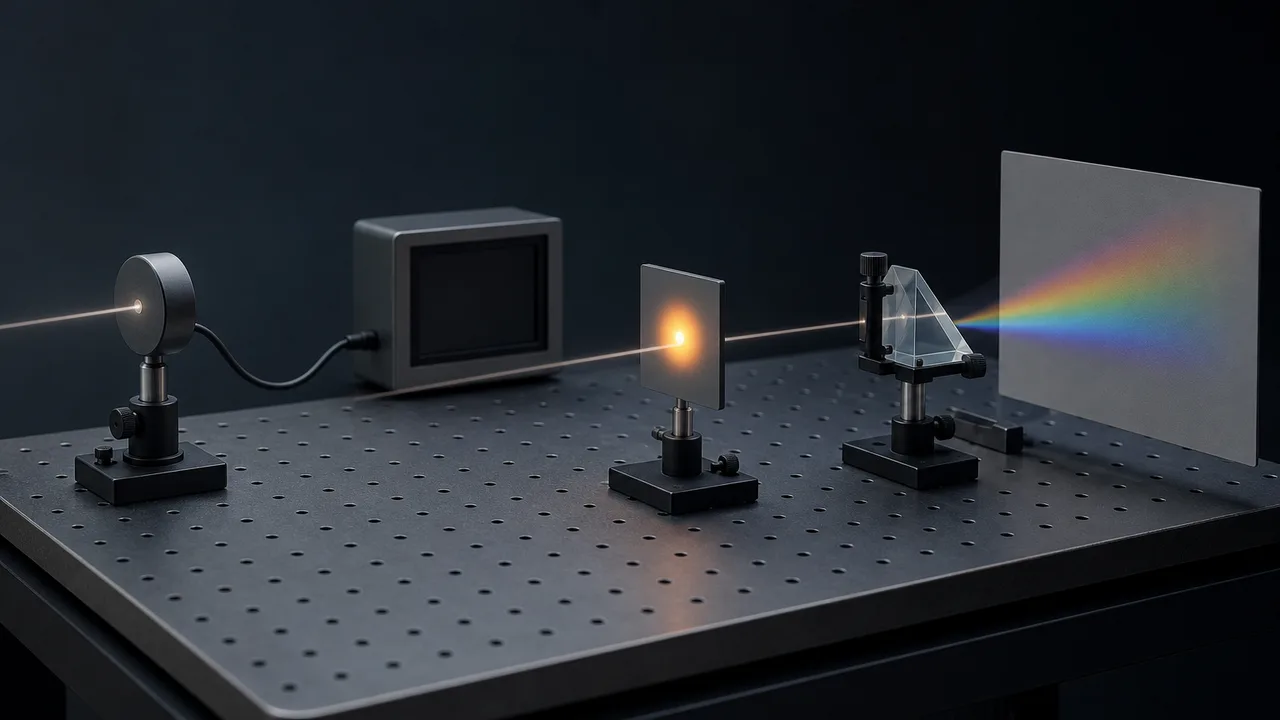
A laser spec sheet is a column of numbers. It lists so many watts of power and a beam quality figure. It also gives a wavelength in nanometers and a linewidth.
Someone measured each of those numbers with an instrument. So what does that instrument actually measure, and how?
Three instruments cover the basics: power, shape and color. A power meter (optical power meter) shows the power or energy carried by the whole beam as one number. A beam profiler shows how intensity spreads across the beam's cross-section, and a spectrum analyzer splits light by wavelength and shows the intensity at each one.
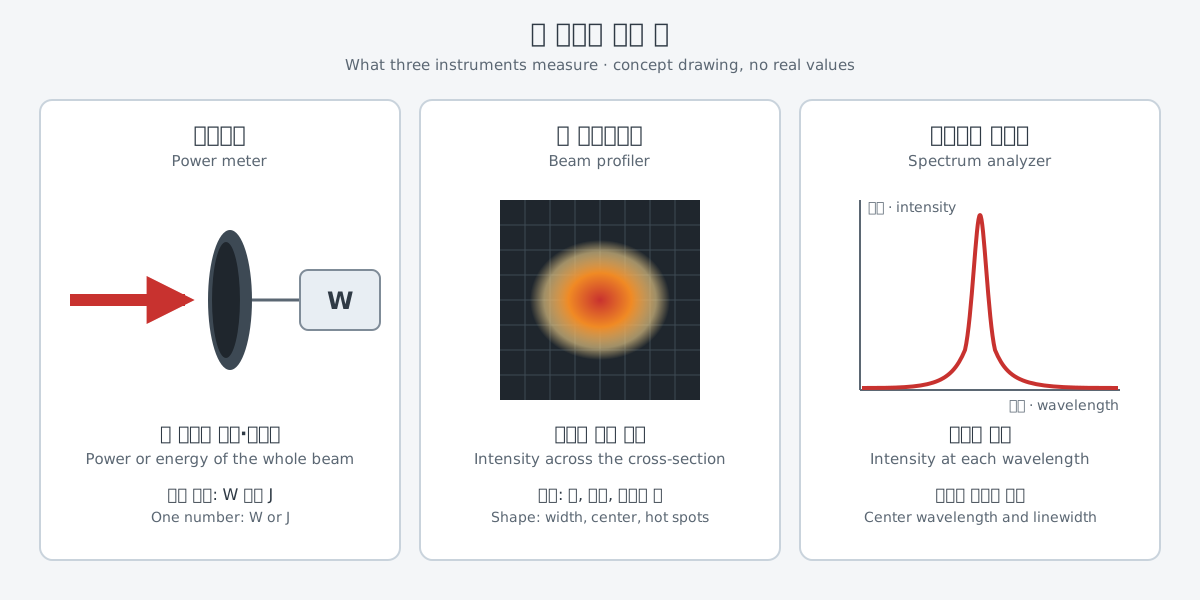
None of the three can stand in for another. Two beams with the same power can have different shapes, and two beams with the same shape can have different wavelengths and linewidths. This article looks at what each instrument measures and what it takes to trust the numbers. If power, energy and intensity feel unfamiliar, "Power, energy and intensity" is a good place to start.
Power meters: turning light into heat or current
A power meter does not count light directly. It lets a sensor absorb the light, turns it into a voltage or a current, and reads that electrical signal out in watts (W) or joules (J). So the key to a power meter is what its sensor turns light into.
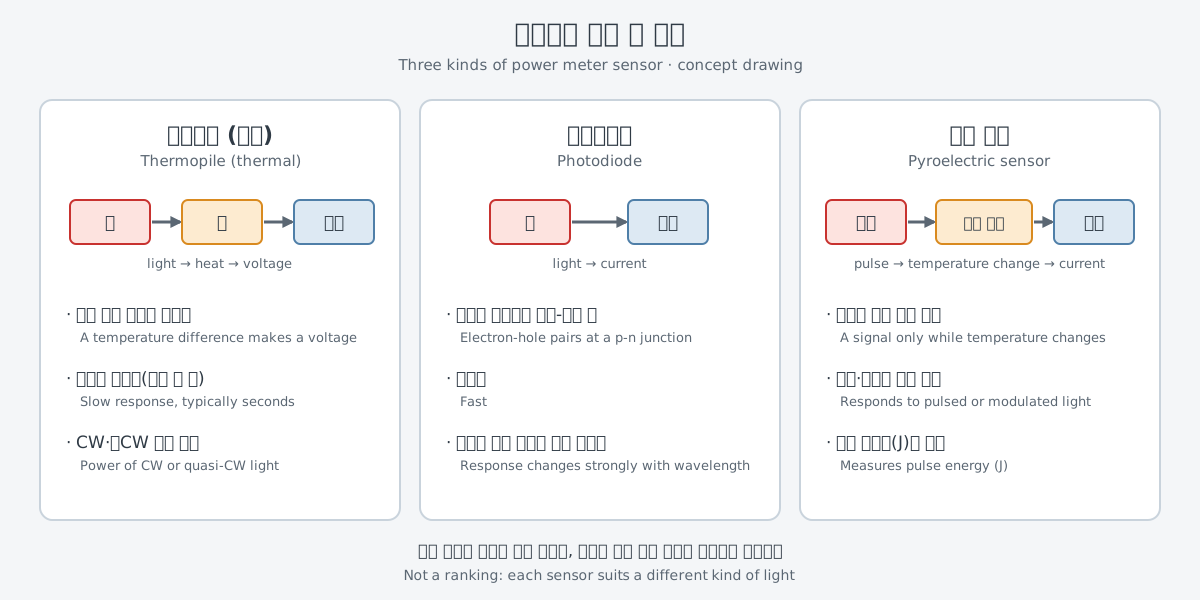
The first kind goes through heat: the thermopile. A thermopile is a sensor built from many thermocouples, each a junction of two different metals. The side that receives light is heated by the laser, and the other side sits on a heat sink, so a temperature difference forms between the two faces. The voltage this creates is proportional to the temperature difference, which in turn is proportional to the laser power.
The second kind turns light straight into current: the photodiode. A photodiode is a semiconductor p-n junction. When light falls on the junction, electrons and holes form in pairs and a current flows. With no heating step in between, it responds quickly.
The third kind is the pyroelectric sensor. A laser pulse heats a crystal, the crystal expands, and its electric polarization changes, which drives a current. The size of the resulting voltage change is proportional to the energy of the original pulse, the pulse energy.
Each sensor suits a different kind of light
The three sensors differ in speed, in wavelength range and in the kind of light they handle. A thermopile has to warm up and cool down, so it responds slowly. Newport's technical note puts its response time typically on the order of seconds, which is why thermopiles are used only for the power of CW or quasi-CW sources. There is a general tradeoff between response speed and sensitivity: gaining one means giving up some of the other.
A photodiode can follow light that changes quickly. The catch is that its sensitivity depends strongly on wavelength, because its responsivity is set by the bandgap of the semiconductor.
So measuring instruments choose the sensor material by the wavelength to be measured. In beam profilers, for example, silicon is sensitive in the visible and near infrared, and germanium or indium gallium arsenide (InGaAs) sensors are also used in the near infrared. Photodiodes are also prone to noise from room light because of their high sensitivity.
A pyroelectric sensor gives a signal only while its temperature is changing. It therefore responds only to pulsed or modulated light and is used to measure the energy of a pulse. Measuring power with the same kind of sensor requires chopping the signal at a set frequency.
These differences lead to two numbers: average power and pulse energy. Average power is a specification given for both CW and pulsed lasers, and for a pulsed laser the energy of one pulse also matters. "Continuous-wave and pulsed lasers" explains what a pulse is.
Very short pulses raise a separate problem. Ursula Keller's textbook Ultrafast Lasers notes that the electronic time resolution of commercial systems is limited to between 1 and 10 ps. A photodetector measures only the intensity of a pulse and, without interferometric techniques, cannot see its phase, so shorter pulses are measured another way, such as optical autocorrelation.
Very strong light has yet another route. In water calorimetry, cooling water carries away the heat built up in an absorber, and the power is found from the water's flow rate and temperature change. Like a thermopile it turns light into heat; it just reads that heat a different way.
Making readings trustworthy: calibration
What guarantees that the watt value on a power meter's screen is right? The answer is calibration. To turn a sensor's electrical signal into watts, the sensor must first be compared with a reference whose value is known exactly.
Calibration works like a chain. Traceability is the property of a measurement result that lets it be related to a reference through an unbroken chain of calibrations. A policy document from the U.S. National Institute of Standards and Technology (NIST) explains that this chain typically reaches national or international standards. Each link in it adds to the measurement uncertainty.
National standards laboratories offer this as a service. A NIST calibration service document covers absolute power and energy measurements of power meters and detectors used with continuous-wave lasers, at wavelengths from 325 to 1550 nm. The calibration report includes an absolute calibration factor together with an uncertainty assessment. A calibrated value comes with an uncertainty that says how far it can be trusted.
Beam profilers: looking at the beam's cross-section
A power meter reduces a whole beam to one number. Yet the same power can be spread evenly or packed into the center, and that changes what the beam is good for. Knowing the intensity where the beam is used, also called irradiance, requires measuring the beam profile.
A beam profiler is a device that measures and analyzes the spatial distribution of a laser beam. A beam profile is often compared to a snapshot of the laser's cross-section. It captures, in one picture, how intensity is spread along the horizontal and vertical axes. In practice it is less a photo of something visible and more a map that records the intensity received at each position.
From this map come values such as the beam width, the beam's center, how oval it is and which way it is tilted. There are several definitions of where a beam's width ends. A common yardstick is the radius of a Gaussian beam, covered in "Why a beam spreads: divergence, focus and aperture".
Measuring the beam profile is also part of measuring beam quality (M²). M² is a factor that shows how close a laser comes to an ideal Gaussian beam.
Beam profilers come in two main kinds. A camera-based profiler records the whole cross-section at once with an array detector such as a CCD or CMOS sensor. A scanning-slit profiler moves a narrow slit across the beam and builds the profile from one detector that receives a part of the beam at a time.
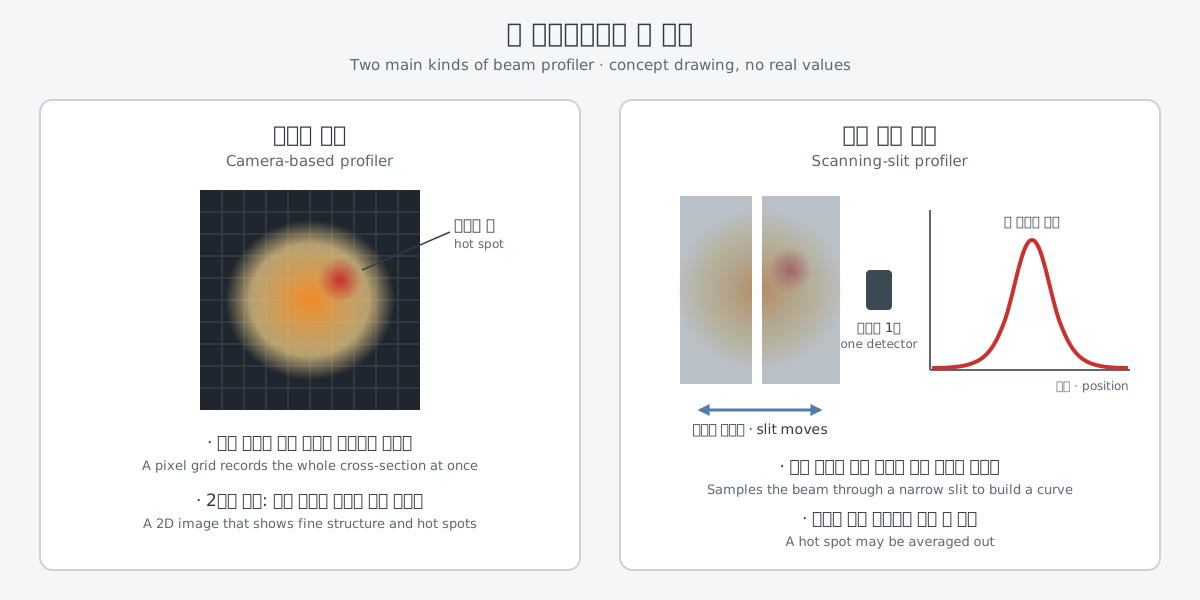
The two kinds show different things. A camera gives a true two-dimensional image that reveals fine structure and hot spots, while a scanning slit may average those features away. A slit profiler, on the other hand, usually gives a more accurate beam size and can measure very small beams directly. Either way there is a sensor inside, so light that is too strong can saturate or damage it.
A beam's shape is not something to measure once and forget. Even a new laser matches its specification only within set tolerances, and its characteristics can drift further with age. The path that delivers the light can also change with temperature and humidity, contamination such as dust, and damaged optics.
Spectrum analyzers and wavelength meters: splitting light by color
Shine sunlight through a prism and it spreads into rainbow colors. An optical spectrum analyzer (OSA) starts from the same idea, but it measures the amount of light with a detector instead of an eye. Light sent to a diffraction grating or a prism leaves in a different direction for each wavelength. The direction tells you the wavelength, and the amount of light arriving in that direction tells you its intensity.
The name depends on how the detector is used. Keller's textbook calls an instrument that rotates the grating or prism in front of a single detector, measuring one wavelength at a time, a monochromator. An instrument that measures all of the spread-out light at once with a detector array or a CCD camera is an optical multichannel analyzer (OMA). An OMA usually has a lower wavelength resolution than a monochromator.
Another instrument for measuring wavelength is the wavelength meter. Fiber Optic Test and Measurement, edited by Dennis Derickson, is a reference for optical fiber measurement. It gives wavelength meters a chapter of their own and puts the Michelson interferometer at its center. "Interference and diffraction" explains what an interferometer does.
Linewidth and coherence time
Laser light is often said to have a single wavelength, but a closer look at the spectrum always shows some width. That width is the linewidth. Linewidth is usually given as the full width at half maximum (FWHM) of the spectrum. It is the width measured where the curve falls to half of its peak height.
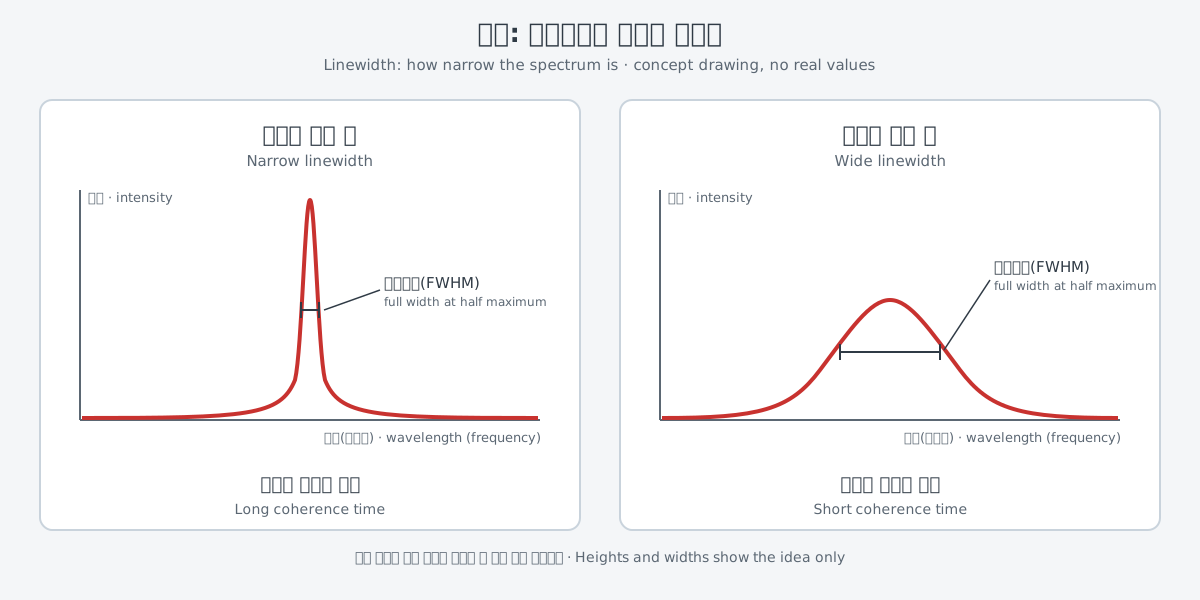
Linewidth goes hand in hand with coherence time. Coherence time is the approximate time difference over which two parts of a laser's light can interfere stably, and it is usually measured with an optical interferometer. Keller's textbook states that a narrow linewidth corresponds to a long coherence time. There is no single fixed way to define coherence time, so definitions differ a little from text to text.
There are also methods that measure linewidth on its own. For semiconductor diode lasers, for example, there is heterodyne measurement against a highly stable reference laser and self-heterodyne measurement that uses the laser's own light. Derickson's book devotes a chapter titled "High Resolution Optical Frequency Analysis" to linewidth measurements of this kind.
Measurement and high-power lasers
Specs such as linewidth also appear in material from high-power laser makers; one fiber amplifier maker lists narrow linewidth as a feature of its products. Exail lists a narrow-linewidth single-frequency laser among its parts for directed-energy lasers. It writes that the maximum power a single fiber amplifier can deliver is severely limited by the nonlinear Brillouin effect, and it discusses linewidth in that same explanation. That effect is stimulated Brillouin scattering (SBS), and "Limits of a single fiber (1): nonlinear effects (SBS, SRS)" covers it in detail.
In short, behind each number on a spec sheet stand the instrument that measured it and the calibration chain behind that instrument. Power comes from a power meter, beam shape and beam quality from a beam profiler, and wavelength and linewidth from a spectrum analyzer or wavelength meter. When a laser figure shows up in the news, asking what was actually measured is a good first step.
What to read next
"Beam quality: M², divergence and brightness" shows how the values a beam profiler measures lead to beam quality.
"Limits of a single fiber (1): nonlinear effects (SBS, SRS)" explains why linewidth matters in high-power fiber lasers. "Inside a laser lab: from the optical table to the power meter" shows where these instruments sit in a lab.